|
Download Data (XLS File) |
|
|||||
|
|||||
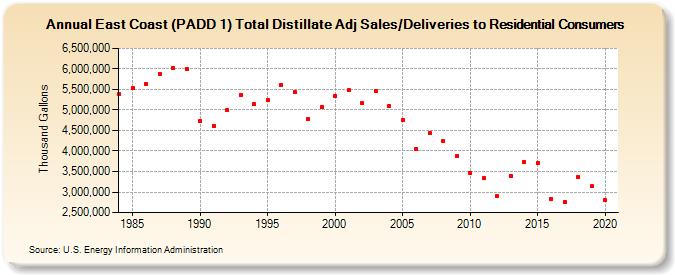
| East Coast (PADD 1) Total Distillate Adj Sales/Deliveries to Residential Consumers (Thousand Gallons) | |||||
| Decade | Year-0 | Year-1 | Year-2 | Year-3 | Year-4 | Year-5 | Year-6 | Year-7 | Year-8 | Year-9 |
|---|---|---|---|---|---|---|---|---|---|---|
| 1980's | 5,399,783 | 5,540,552 | 5,640,866 | 5,883,446 | 6,019,068 | 6,003,771 | ||||
| 1990's | 4,725,874 | 4,618,622 | 5,004,006 | 5,364,780 | 5,135,439 | 5,230,793 | 5,610,264 | 5,430,114 | 4,783,009 | 5,067,702 |
| 2000's | 5,329,890 | 5,479,535 | 5,159,955 | 5,457,105 | 5,101,920 | 4,759,198 | 4,054,212 | 4,437,380 | 4,235,514 | 3,876,746 |
| 2010's | 3,468,399 | 3,332,907 | 2,910,907 | 3,402,392 | 3,741,851 | 3,711,080 | 2,842,346 | 2,764,617 | 3,361,137 | 3,135,849 |
| 2020's | 2,804,181 |
| - = No Data Reported; -- = Not Applicable; NA = Not Available; W = Withheld to avoid disclosure of individual company data. |
| Release Date: 2/9/2022 |
| Next Release Date: Suspended |