|
Download Data (XLS File) |
|
|||||
|
|||||
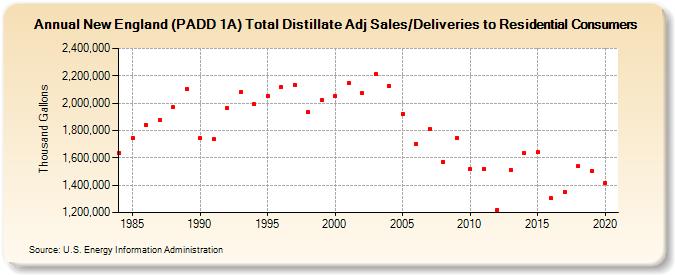
| New England (PADD 1A) Total Distillate Adj Sales/Deliveries to Residential Consumers (Thousand Gallons) | |||||
| Decade | Year-0 | Year-1 | Year-2 | Year-3 | Year-4 | Year-5 | Year-6 | Year-7 | Year-8 | Year-9 |
|---|---|---|---|---|---|---|---|---|---|---|
| 1980's | 1,635,583 | 1,746,558 | 1,840,656 | 1,875,966 | 1,968,313 | 2,103,316 | ||||
| 1990's | 1,744,239 | 1,734,975 | 1,960,947 | 2,078,564 | 1,990,851 | 2,053,812 | 2,114,262 | 2,133,604 | 1,933,505 | 2,021,728 |
| 2000's | 2,052,959 | 2,148,315 | 2,070,341 | 2,212,547 | 2,126,180 | 1,923,405 | 1,704,401 | 1,809,559 | 1,571,459 | 1,745,432 |
| 2010's | 1,515,299 | 1,520,320 | 1,219,745 | 1,513,416 | 1,635,074 | 1,640,031 | 1,303,873 | 1,350,762 | 1,536,706 | 1,503,990 |
| 2020's | 1,417,060 |
| - = No Data Reported; -- = Not Applicable; NA = Not Available; W = Withheld to avoid disclosure of individual company data. |
| Release Date: 2/9/2022 |
| Next Release Date: Suspended |