|
Download Data (XLS File) |
|
|||||
|
|||||
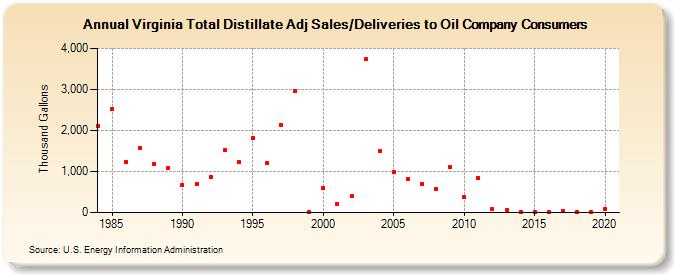
| Virginia Total Distillate Adj Sales/Deliveries to Oil Company Consumers (Thousand Gallons) | |||||
| Decade | Year-0 | Year-1 | Year-2 | Year-3 | Year-4 | Year-5 | Year-6 | Year-7 | Year-8 | Year-9 |
|---|---|---|---|---|---|---|---|---|---|---|
| 1980's | 2,114 | 2,531 | 1,233 | 1,569 | 1,191 | 1,088 | ||||
| 1990's | 672 | 697 | 875 | 1,520 | 1,227 | 1,827 | 1,202 | 2,131 | 2,967 | 3 |
| 2000's | 588 | 207 | 395 | 3,745 | 1,489 | 979 | 811 | 707 | 579 | 1,104 |
| 2010's | 375 | 841 | 92 | 73 | 18 | 25 | 16 | 39 | 3 | 4 |
| 2020's | 90 |
| - = No Data Reported; -- = Not Applicable; NA = Not Available; W = Withheld to avoid disclosure of individual company data. |
| Release Date: 2/9/2022 |
| Next Release Date: Suspended |