|
Download Data (XLS File) |
|
|||||
|
|||||
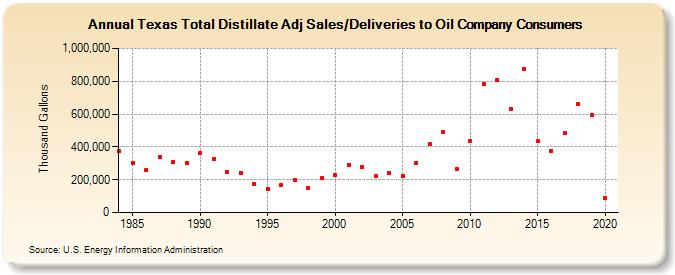
| Texas Total Distillate Adj Sales/Deliveries to Oil Company Consumers (Thousand Gallons) | |||||
| Decade | Year-0 | Year-1 | Year-2 | Year-3 | Year-4 | Year-5 | Year-6 | Year-7 | Year-8 | Year-9 |
|---|---|---|---|---|---|---|---|---|---|---|
| 1980's | 373,343 | 304,537 | 256,724 | 340,970 | 309,844 | 302,383 | ||||
| 1990's | 362,958 | 325,505 | 249,111 | 241,131 | 171,296 | 142,242 | 168,867 | 197,969 | 147,434 | 207,755 |
| 2000's | 228,134 | 292,472 | 278,441 | 221,485 | 242,479 | 225,254 | 298,931 | 415,497 | 488,251 | 265,441 |
| 2010's | 436,183 | 783,727 | 808,559 | 633,170 | 875,390 | 434,955 | 375,525 | 485,254 | 662,425 | 595,287 |
| 2020's | 89,576 |
| - = No Data Reported; -- = Not Applicable; NA = Not Available; W = Withheld to avoid disclosure of individual company data. |
| Release Date: 2/9/2022 |
| Next Release Date: Suspended |