|
Download Data (XLS File) |
|
|||||
|
|||||
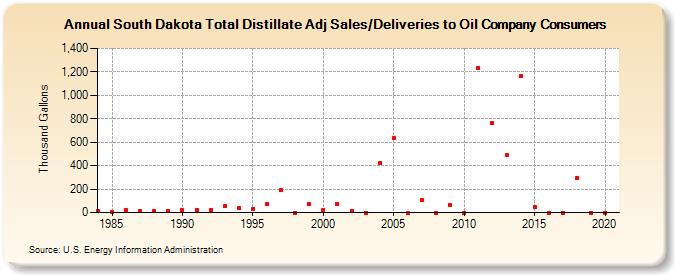
| South Dakota Total Distillate Adj Sales/Deliveries to Oil Company Consumers (Thousand Gallons) | |||||
| Decade | Year-0 | Year-1 | Year-2 | Year-3 | Year-4 | Year-5 | Year-6 | Year-7 | Year-8 | Year-9 |
|---|---|---|---|---|---|---|---|---|---|---|
| 1980's | 15 | 5 | 20 | 13 | 11 | 12 | ||||
| 1990's | 21 | 19 | 19 | 52 | 42 | 30 | 77 | 190 | 0 | 73 |
| 2000's | 25 | 72 | 11 | 0 | 422 | 633 | 0 | 105 | 0 | 62 |
| 2010's | 0 | 1,231 | 765 | 495 | 1,162 | 45 | 0 | 0 | 293 | 0 |
| 2020's | 0 |
| - = No Data Reported; -- = Not Applicable; NA = Not Available; W = Withheld to avoid disclosure of individual company data. |
| Release Date: 2/9/2022 |
| Next Release Date: Suspended |