|
Download Data (XLS File) |
|
|||||
|
|||||
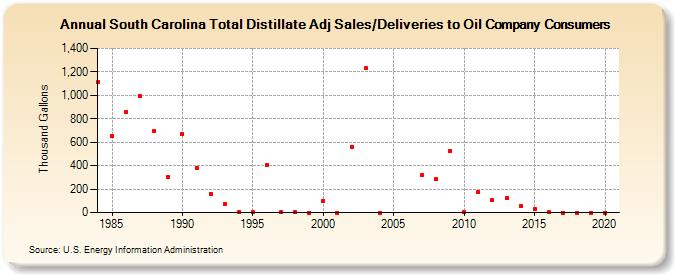
| South Carolina Total Distillate Adj Sales/Deliveries to Oil Company Consumers (Thousand Gallons) | |||||
| Decade | Year-0 | Year-1 | Year-2 | Year-3 | Year-4 | Year-5 | Year-6 | Year-7 | Year-8 | Year-9 |
|---|---|---|---|---|---|---|---|---|---|---|
| 1980's | 1,114 | 655 | 860 | 991 | 692 | 299 | ||||
| 1990's | 671 | 384 | 162 | 70 | 1 | 1 | 408 | 1 | 4 | 0 |
| 2000's | 99 | 0 | 560 | 1,230 | 0 | -- | -- | 319 | 282 | 525 |
| 2010's | 2 | 177 | 104 | 121 | 57 | 28 | 4 | 0 | 0 | 0 |
| 2020's | 0 |
| - = No Data Reported; -- = Not Applicable; NA = Not Available; W = Withheld to avoid disclosure of individual company data. |
| Release Date: 2/9/2022 |
| Next Release Date: Suspended |