|
Download Data (XLS File) |
|
|||||
|
|||||
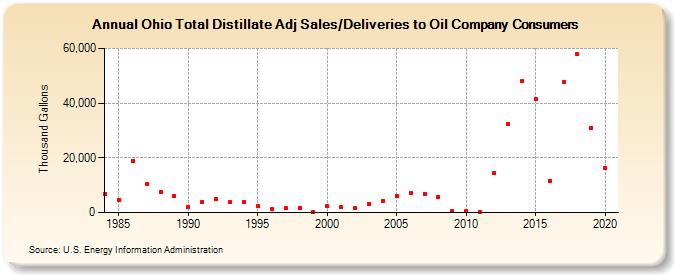
| Ohio Total Distillate Adj Sales/Deliveries to Oil Company Consumers (Thousand Gallons) | |||||
| Decade | Year-0 | Year-1 | Year-2 | Year-3 | Year-4 | Year-5 | Year-6 | Year-7 | Year-8 | Year-9 |
|---|---|---|---|---|---|---|---|---|---|---|
| 1980's | 6,844 | 4,631 | 18,851 | 10,341 | 7,547 | 6,153 | ||||
| 1990's | 2,037 | 3,698 | 4,910 | 3,719 | 3,817 | 2,234 | 1,136 | 1,487 | 1,491 | 266 |
| 2000's | 2,225 | 1,920 | 1,545 | 3,180 | 4,274 | 6,179 | 7,139 | 6,943 | 5,596 | 522 |
| 2010's | 608 | 232 | 14,470 | 32,352 | 48,025 | 41,403 | 11,654 | 47,734 | 57,937 | 31,039 |
| 2020's | 16,118 |
| - = No Data Reported; -- = Not Applicable; NA = Not Available; W = Withheld to avoid disclosure of individual company data. |
| Release Date: 2/9/2022 |
| Next Release Date: Suspended |