|
Download Data (XLS File) |
|
|||||
|
|||||
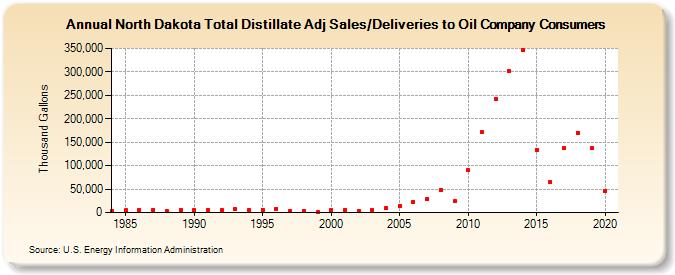
| North Dakota Total Distillate Adj Sales/Deliveries to Oil Company Consumers (Thousand Gallons) | |||||
| Decade | Year-0 | Year-1 | Year-2 | Year-3 | Year-4 | Year-5 | Year-6 | Year-7 | Year-8 | Year-9 |
|---|---|---|---|---|---|---|---|---|---|---|
| 1980's | 3,298 | 4,412 | 4,939 | 6,089 | 2,686 | 4,421 | ||||
| 1990's | 5,528 | 5,861 | 5,658 | 6,846 | 4,785 | 6,388 | 8,281 | 3,692 | 4,295 | 1,514 |
| 2000's | 5,550 | 5,940 | 3,421 | 5,366 | 9,908 | 14,841 | 23,306 | 28,663 | 48,273 | 23,924 |
| 2010's | 90,048 | 171,170 | 241,770 | 301,624 | 345,747 | 134,398 | 64,934 | 136,962 | 170,460 | 136,783 |
| 2020's | 47,016 |
| - = No Data Reported; -- = Not Applicable; NA = Not Available; W = Withheld to avoid disclosure of individual company data. |
| Release Date: 2/9/2022 |
| Next Release Date: Suspended |