|
Download Data (XLS File) |
|
|||||
|
|||||
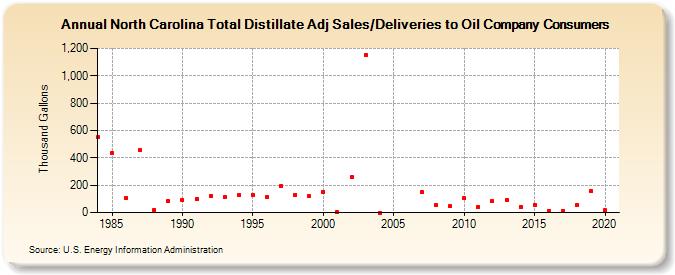
| North Carolina Total Distillate Adj Sales/Deliveries to Oil Company Consumers (Thousand Gallons) | |||||
| Decade | Year-0 | Year-1 | Year-2 | Year-3 | Year-4 | Year-5 | Year-6 | Year-7 | Year-8 | Year-9 |
|---|---|---|---|---|---|---|---|---|---|---|
| 1980's | 552 | 432 | 110 | 454 | 22 | 81 | ||||
| 1990's | 90 | 98 | 120 | 111 | 131 | 129 | 113 | 191 | 132 | 119 |
| 2000's | 153 | 1 | 257 | 1,153 | 0 | -- | -- | 148 | 53 | 45 |
| 2010's | 103 | 42 | 85 | 94 | 43 | 57 | 13 | 12 | 53 | 157 |
| 2020's | 16 |
| - = No Data Reported; -- = Not Applicable; NA = Not Available; W = Withheld to avoid disclosure of individual company data. |
| Release Date: 2/9/2022 |
| Next Release Date: Suspended |