|
Download Data (XLS File) |
|
|||||
|
|||||
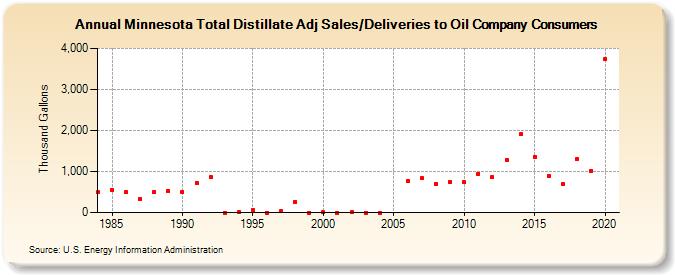
| Minnesota Total Distillate Adj Sales/Deliveries to Oil Company Consumers (Thousand Gallons) | |||||
| Decade | Year-0 | Year-1 | Year-2 | Year-3 | Year-4 | Year-5 | Year-6 | Year-7 | Year-8 | Year-9 |
|---|---|---|---|---|---|---|---|---|---|---|
| 1980's | 489 | 556 | 498 | 333 | 512 | 524 | ||||
| 1990's | 503 | 728 | 858 | 1 | 8 | 70 | 0 | 26 | 267 | 0 |
| 2000's | 4 | 0 | 2 | 0 | 0 | -- | 764 | 831 | 708 | 750 |
| 2010's | 737 | 949 | 863 | 1,289 | 1,911 | 1,357 | 902 | 687 | 1,304 | 1,024 |
| 2020's | 3,733 |
| - = No Data Reported; -- = Not Applicable; NA = Not Available; W = Withheld to avoid disclosure of individual company data. |
| Release Date: 2/9/2022 |
| Next Release Date: Suspended |