|
Download Data (XLS File) |
|
|||||
|
|||||
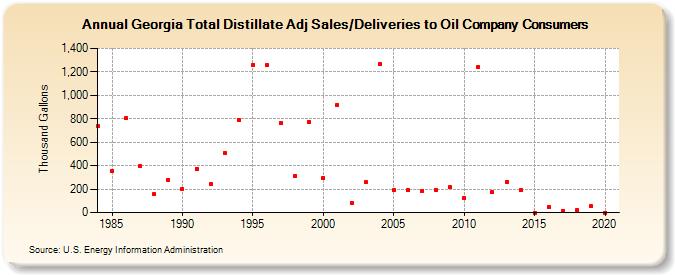
| Georgia Total Distillate Adj Sales/Deliveries to Oil Company Consumers (Thousand Gallons) | |||||
| Decade | Year-0 | Year-1 | Year-2 | Year-3 | Year-4 | Year-5 | Year-6 | Year-7 | Year-8 | Year-9 |
|---|---|---|---|---|---|---|---|---|---|---|
| 1980's | 734 | 354 | 806 | 398 | 156 | 280 | ||||
| 1990's | 203 | 374 | 242 | 510 | 791 | 1,259 | 1,256 | 763 | 315 | 771 |
| 2000's | 298 | 921 | 83 | 257 | 1,266 | 191 | 190 | 182 | 196 | 214 |
| 2010's | 127 | 1,242 | 172 | 262 | 191 | 0 | 51 | 16 | 18 | 52 |
| 2020's | 0 |
| - = No Data Reported; -- = Not Applicable; NA = Not Available; W = Withheld to avoid disclosure of individual company data. |
| Release Date: 2/9/2022 |
| Next Release Date: Suspended |