|
Download Data (XLS File) |
|
|||||
|
|||||
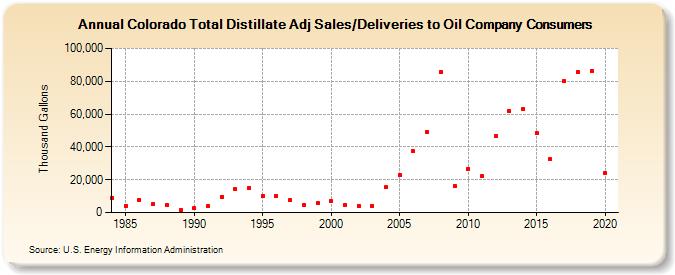
| Colorado Total Distillate Adj Sales/Deliveries to Oil Company Consumers (Thousand Gallons) | |||||
| Decade | Year-0 | Year-1 | Year-2 | Year-3 | Year-4 | Year-5 | Year-6 | Year-7 | Year-8 | Year-9 |
|---|---|---|---|---|---|---|---|---|---|---|
| 1980's | 9,053 | 4,258 | 7,883 | 5,012 | 4,329 | 1,316 | ||||
| 1990's | 2,501 | 3,803 | 9,694 | 14,136 | 14,948 | 10,007 | 10,083 | 7,708 | 4,903 | 5,719 |
| 2000's | 6,875 | 4,305 | 4,193 | 4,229 | 15,348 | 22,646 | 37,230 | 49,138 | 85,861 | 16,033 |
| 2010's | 26,729 | 22,254 | 46,478 | 61,773 | 62,978 | 48,348 | 32,435 | 80,171 | 85,685 | 86,462 |
| 2020's | 24,222 |
| - = No Data Reported; -- = Not Applicable; NA = Not Available; W = Withheld to avoid disclosure of individual company data. |
| Release Date: 2/9/2022 |
| Next Release Date: Suspended |