|
Download Data (XLS File) |
|
|||||
|
|||||
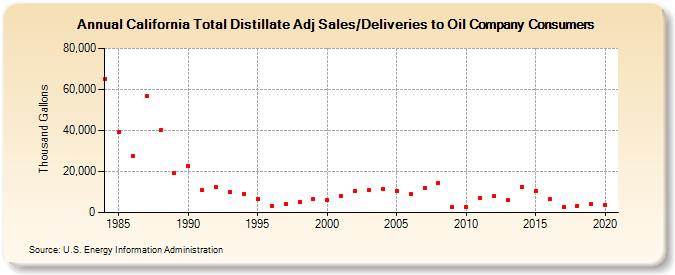
| California Total Distillate Adj Sales/Deliveries to Oil Company Consumers (Thousand Gallons) | |||||
| Decade | Year-0 | Year-1 | Year-2 | Year-3 | Year-4 | Year-5 | Year-6 | Year-7 | Year-8 | Year-9 |
|---|---|---|---|---|---|---|---|---|---|---|
| 1980's | 65,285 | 39,234 | 27,370 | 56,670 | 40,105 | 19,399 | ||||
| 1990's | 22,836 | 11,135 | 12,248 | 10,254 | 9,213 | 6,826 | 3,352 | 4,036 | 5,334 | 6,588 |
| 2000's | 6,038 | 7,963 | 10,389 | 10,886 | 11,588 | 10,417 | 8,877 | 12,171 | 14,646 | 2,687 |
| 2010's | 2,566 | 6,915 | 7,846 | 6,082 | 12,667 | 10,724 | 6,474 | 2,665 | 3,359 | 4,278 |
| 2020's | 3,565 |
| - = No Data Reported; -- = Not Applicable; NA = Not Available; W = Withheld to avoid disclosure of individual company data. |
| Release Date: 2/9/2022 |
| Next Release Date: Suspended |