|
Download Data (XLS File) |
|
|||||
|
|||||
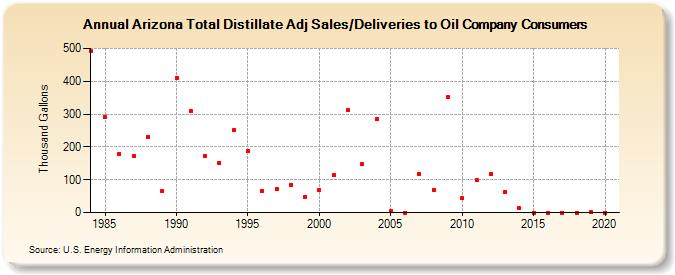
| Arizona Total Distillate Adj Sales/Deliveries to Oil Company Consumers (Thousand Gallons) | |||||
| Decade | Year-0 | Year-1 | Year-2 | Year-3 | Year-4 | Year-5 | Year-6 | Year-7 | Year-8 | Year-9 |
|---|---|---|---|---|---|---|---|---|---|---|
| 1980's | 491 | 291 | 179 | 173 | 231 | 67 | ||||
| 1990's | 411 | 308 | 173 | 151 | 251 | 188 | 66 | 71 | 85 | 48 |
| 2000's | 69 | 115 | 311 | 147 | 284 | 4 | 0 | 117 | 70 | 352 |
| 2010's | 43 | 98 | 117 | 64 | 13 | 0 | 0 | 0 | 0 | 3 |
| 2020's | 0 |
| - = No Data Reported; -- = Not Applicable; NA = Not Available; W = Withheld to avoid disclosure of individual company data. |
| Release Date: 2/9/2022 |
| Next Release Date: Suspended |