|
Download Data (XLS File) |
|
|||||
|
|||||
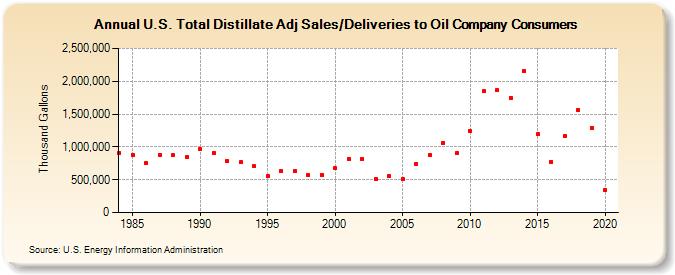
| U.S. Total Distillate Adj Sales/Deliveries to Oil Company Consumers (Thousand Gallons) | |||||
| Decade | Year-0 | Year-1 | Year-2 | Year-3 | Year-4 | Year-5 | Year-6 | Year-7 | Year-8 | Year-9 |
|---|---|---|---|---|---|---|---|---|---|---|
| 1980's | 908,162 | 876,505 | 749,992 | 881,729 | 872,133 | 845,217 | ||||
| 1990's | 968,764 | 910,761 | 785,120 | 763,068 | 703,946 | 556,126 | 625,608 | 632,595 | 565,174 | 576,997 |
| 2000's | 671,170 | 822,797 | 821,883 | 504,297 | 553,427 | 504,483 | 740,347 | 878,744 | 1,063,516 | 899,469 |
| 2010's | 1,240,257 | 1,844,918 | 1,861,647 | 1,749,949 | 2,158,866 | 1,190,677 | 775,199 | 1,159,982 | 1,559,207 | 1,290,522 |
| 2020's | 347,185 |
| - = No Data Reported; -- = Not Applicable; NA = Not Available; W = Withheld to avoid disclosure of individual company data. |
| Release Date: 2/9/2022 |
| Next Release Date: Suspended |