|
Download Data (XLS File) |
|
|||||
|
|||||
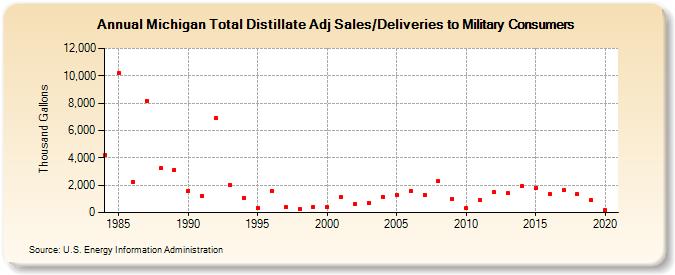
| Michigan Total Distillate Adj Sales/Deliveries to Military Consumers (Thousand Gallons) | |||||
| Decade | Year-0 | Year-1 | Year-2 | Year-3 | Year-4 | Year-5 | Year-6 | Year-7 | Year-8 | Year-9 |
|---|---|---|---|---|---|---|---|---|---|---|
| 1980's | 4,224 | 10,178 | 2,235 | 8,150 | 3,222 | 3,146 | ||||
| 1990's | 1,610 | 1,242 | 6,897 | 2,021 | 1,087 | 362 | 1,595 | 381 | 262 | 421 |
| 2000's | 419 | 1,134 | 641 | 727 | 1,152 | 1,291 | 1,584 | 1,303 | 2,279 | 1,012 |
| 2010's | 329 | 913 | 1,489 | 1,411 | 1,921 | 1,782 | 1,343 | 1,614 | 1,328 | 902 |
| 2020's | 184 |
| - = No Data Reported; -- = Not Applicable; NA = Not Available; W = Withheld to avoid disclosure of individual company data. |
| Release Date: 2/9/2022 |
| Next Release Date: Suspended |