|
Download Data (XLS File) |
|
|||||
|
|||||
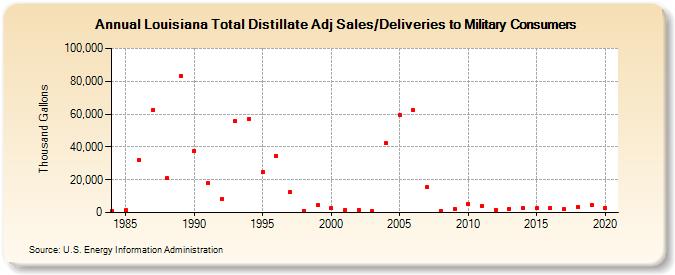
| Louisiana Total Distillate Adj Sales/Deliveries to Military Consumers (Thousand Gallons) | |||||
| Decade | Year-0 | Year-1 | Year-2 | Year-3 | Year-4 | Year-5 | Year-6 | Year-7 | Year-8 | Year-9 |
|---|---|---|---|---|---|---|---|---|---|---|
| 1980's | 686 | 1,303 | 31,871 | 62,644 | 20,955 | 83,075 | ||||
| 1990's | 37,541 | 17,763 | 8,538 | 55,618 | 57,169 | 24,663 | 34,426 | 12,543 | 1,131 | 4,419 |
| 2000's | 2,515 | 1,526 | 1,542 | 662 | 42,106 | 59,179 | 62,232 | 15,435 | 1,046 | 2,038 |
| 2010's | 5,364 | 4,196 | 1,810 | 2,171 | 2,522 | 2,610 | 2,832 | 1,929 | 3,487 | 4,735 |
| 2020's | 2,931 |
| - = No Data Reported; -- = Not Applicable; NA = Not Available; W = Withheld to avoid disclosure of individual company data. |
| Release Date: 2/9/2022 |
| Next Release Date: Suspended |