|
Download Data (XLS File) |
|
|||||
|
|||||
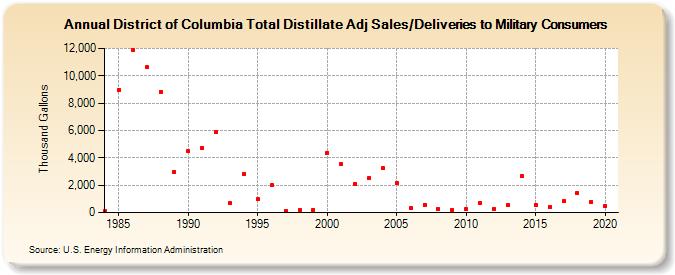
| District of Columbia Total Distillate Adj Sales/Deliveries to Military Consumers (Thousand Gallons) | |||||
| Decade | Year-0 | Year-1 | Year-2 | Year-3 | Year-4 | Year-5 | Year-6 | Year-7 | Year-8 | Year-9 |
|---|---|---|---|---|---|---|---|---|---|---|
| 1980's | 94 | 8,983 | 11,903 | 10,618 | 8,836 | 2,996 | ||||
| 1990's | 4,481 | 4,751 | 5,887 | 686 | 2,813 | 968 | 2,008 | 134 | 158 | 186 |
| 2000's | 4,389 | 3,518 | 2,109 | 2,519 | 3,221 | 2,137 | 299 | 578 | 247 | 174 |
| 2010's | 260 | 706 | 274 | 544 | 2,676 | 579 | 434 | 830 | 1,427 | 777 |
| 2020's | 512 |
| - = No Data Reported; -- = Not Applicable; NA = Not Available; W = Withheld to avoid disclosure of individual company data. |
| Release Date: 2/9/2022 |
| Next Release Date: Suspended |