|
Download Data (XLS File) |
|
|||||
|
|||||
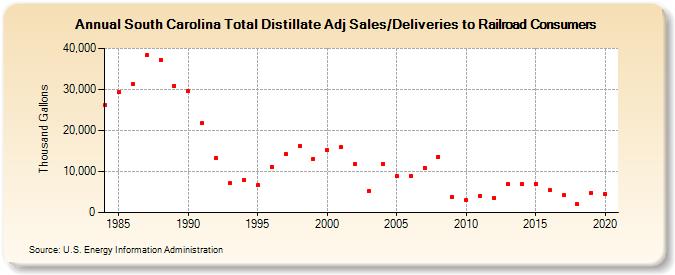
| South Carolina Total Distillate Adj Sales/Deliveries to Railroad Consumers (Thousand Gallons) | |||||
| Decade | Year-0 | Year-1 | Year-2 | Year-3 | Year-4 | Year-5 | Year-6 | Year-7 | Year-8 | Year-9 |
|---|---|---|---|---|---|---|---|---|---|---|
| 1980's | 26,176 | 29,343 | 31,346 | 38,296 | 37,173 | 30,946 | ||||
| 1990's | 29,554 | 21,739 | 13,342 | 7,107 | 8,016 | 6,624 | 11,176 | 14,322 | 16,209 | 13,051 |
| 2000's | 15,189 | 15,967 | 11,759 | 5,267 | 11,910 | 8,842 | 8,965 | 10,949 | 13,620 | 3,804 |
| 2010's | 2,984 | 4,043 | 3,641 | 6,952 | 7,057 | 7,033 | 5,421 | 4,160 | 2,021 | 4,847 |
| 2020's | 4,571 |
| - = No Data Reported; -- = Not Applicable; NA = Not Available; W = Withheld to avoid disclosure of individual company data. |
| Release Date: 2/9/2022 |
| Next Release Date: Suspended |