|
Download Data (XLS File) |
|
|||||
|
|||||
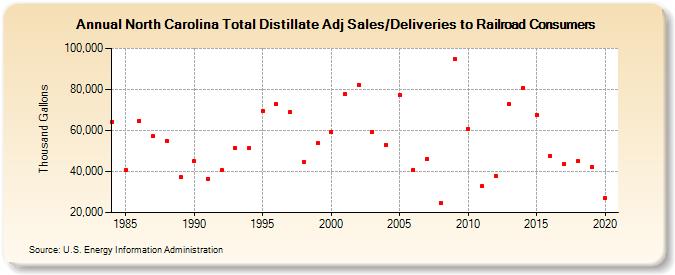
| North Carolina Total Distillate Adj Sales/Deliveries to Railroad Consumers (Thousand Gallons) | |||||
| Decade | Year-0 | Year-1 | Year-2 | Year-3 | Year-4 | Year-5 | Year-6 | Year-7 | Year-8 | Year-9 |
|---|---|---|---|---|---|---|---|---|---|---|
| 1980's | 64,262 | 40,534 | 64,774 | 57,175 | 54,875 | 37,167 | ||||
| 1990's | 45,001 | 36,454 | 40,547 | 51,473 | 51,337 | 69,573 | 72,825 | 69,026 | 44,816 | 53,900 |
| 2000's | 59,358 | 77,911 | 82,253 | 59,437 | 53,084 | 77,308 | 40,905 | 46,282 | 24,669 | 94,857 |
| 2010's | 60,750 | 32,727 | 37,943 | 72,769 | 80,746 | 67,763 | 47,633 | 43,688 | 44,951 | 42,189 |
| 2020's | 27,017 |
| - = No Data Reported; -- = Not Applicable; NA = Not Available; W = Withheld to avoid disclosure of individual company data. |
| Release Date: 2/9/2022 |
| Next Release Date: Suspended |