|
Download Data (XLS File) |
|
|||||
|
|||||
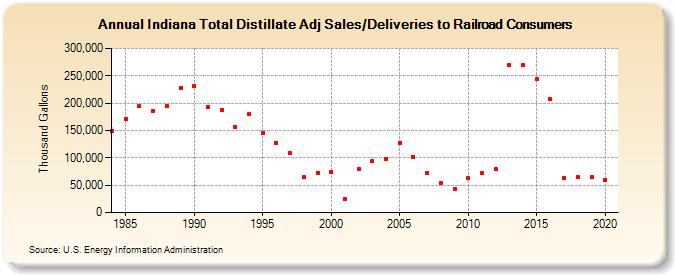
| Indiana Total Distillate Adj Sales/Deliveries to Railroad Consumers (Thousand Gallons) | |||||
| Decade | Year-0 | Year-1 | Year-2 | Year-3 | Year-4 | Year-5 | Year-6 | Year-7 | Year-8 | Year-9 |
|---|---|---|---|---|---|---|---|---|---|---|
| 1980's | 149,767 | 171,422 | 194,143 | 185,655 | 194,874 | 227,166 | ||||
| 1990's | 232,173 | 192,399 | 188,232 | 155,755 | 179,542 | 145,163 | 127,691 | 107,950 | 64,889 | 72,647 |
| 2000's | 74,455 | 24,559 | 78,884 | 94,551 | 98,211 | 127,857 | 101,845 | 72,399 | 54,396 | 42,989 |
| 2010's | 62,571 | 71,774 | 79,836 | 268,931 | 269,665 | 243,306 | 206,698 | 63,884 | 64,716 | 64,653 |
| 2020's | 59,597 |
| - = No Data Reported; -- = Not Applicable; NA = Not Available; W = Withheld to avoid disclosure of individual company data. |
| Release Date: 2/9/2022 |
| Next Release Date: Suspended |