|
Download Data (XLS File) |
|
|||||
|
|||||
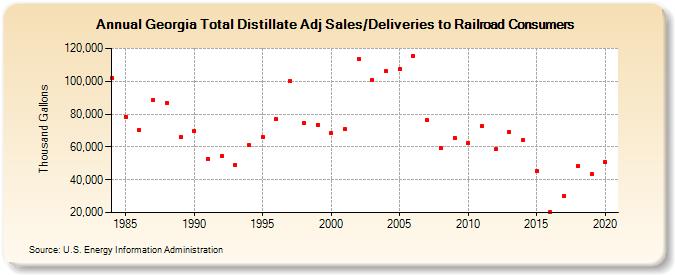
| Georgia Total Distillate Adj Sales/Deliveries to Railroad Consumers (Thousand Gallons) | |||||
| Decade | Year-0 | Year-1 | Year-2 | Year-3 | Year-4 | Year-5 | Year-6 | Year-7 | Year-8 | Year-9 |
|---|---|---|---|---|---|---|---|---|---|---|
| 1980's | 101,676 | 78,421 | 70,226 | 88,701 | 86,978 | 65,938 | ||||
| 1990's | 69,621 | 52,625 | 54,468 | 49,009 | 60,877 | 65,935 | 76,841 | 100,179 | 74,455 | 73,494 |
| 2000's | 68,411 | 70,674 | 113,719 | 100,732 | 105,963 | 107,280 | 115,406 | 76,332 | 59,254 | 65,551 |
| 2010's | 62,380 | 72,637 | 58,424 | 69,308 | 63,992 | 45,134 | 20,097 | 30,021 | 48,411 | 43,266 |
| 2020's | 51,077 |
| - = No Data Reported; -- = Not Applicable; NA = Not Available; W = Withheld to avoid disclosure of individual company data. |
| Release Date: 2/9/2022 |
| Next Release Date: Suspended |