|
Download Data (XLS File) |
|
|||||
|
|||||
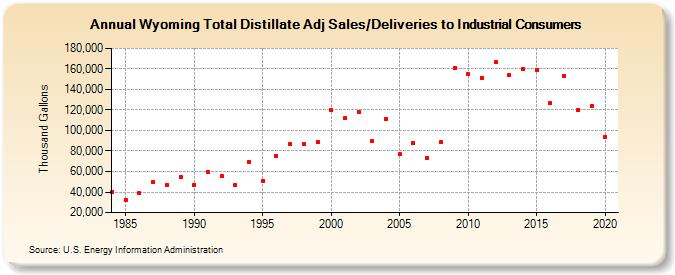
| Wyoming Total Distillate Adj Sales/Deliveries to Industrial Consumers (Thousand Gallons) | |||||
| Decade | Year-0 | Year-1 | Year-2 | Year-3 | Year-4 | Year-5 | Year-6 | Year-7 | Year-8 | Year-9 |
|---|---|---|---|---|---|---|---|---|---|---|
| 1980's | 39,923 | 31,759 | 39,056 | 50,001 | 47,085 | 54,353 | ||||
| 1990's | 46,899 | 59,601 | 55,194 | 46,465 | 69,418 | 51,074 | 75,092 | 86,510 | 86,661 | 88,789 |
| 2000's | 119,614 | 111,976 | 117,837 | 89,397 | 111,286 | 76,692 | 87,587 | 72,943 | 88,432 | 160,949 |
| 2010's | 154,799 | 151,592 | 166,717 | 153,929 | 159,815 | 159,314 | 126,449 | 153,273 | 120,021 | 123,890 |
| 2020's | 93,666 |
| - = No Data Reported; -- = Not Applicable; NA = Not Available; W = Withheld to avoid disclosure of individual company data. |
| Release Date: 2/9/2022 |
| Next Release Date: Suspended |