|
Download Data (XLS File) |
|
|||||
|
|||||
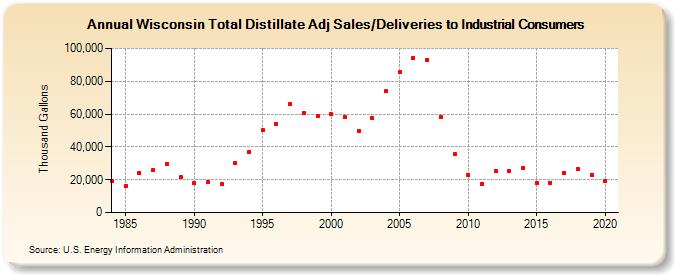
| Wisconsin Total Distillate Adj Sales/Deliveries to Industrial Consumers (Thousand Gallons) | |||||
| Decade | Year-0 | Year-1 | Year-2 | Year-3 | Year-4 | Year-5 | Year-6 | Year-7 | Year-8 | Year-9 |
|---|---|---|---|---|---|---|---|---|---|---|
| 1980's | 19,312 | 16,245 | 24,204 | 25,829 | 29,508 | 21,416 | ||||
| 1990's | 17,869 | 18,384 | 17,497 | 30,015 | 37,126 | 50,045 | 54,023 | 66,226 | 60,397 | 58,889 |
| 2000's | 59,807 | 58,300 | 49,964 | 57,878 | 73,804 | 85,869 | 94,418 | 93,193 | 58,434 | 35,527 |
| 2010's | 23,141 | 17,644 | 25,442 | 25,181 | 27,191 | 17,995 | 18,308 | 23,991 | 26,235 | 22,904 |
| 2020's | 19,079 |
| - = No Data Reported; -- = Not Applicable; NA = Not Available; W = Withheld to avoid disclosure of individual company data. |
| Release Date: 2/9/2022 |
| Next Release Date: Suspended |