|
Download Data (XLS File) |
|
|||||
|
|||||
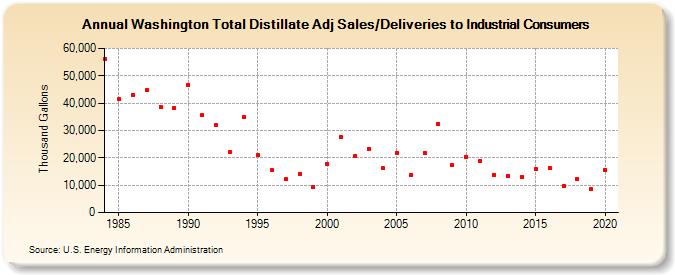
| Washington Total Distillate Adj Sales/Deliveries to Industrial Consumers (Thousand Gallons) | |||||
| Decade | Year-0 | Year-1 | Year-2 | Year-3 | Year-4 | Year-5 | Year-6 | Year-7 | Year-8 | Year-9 |
|---|---|---|---|---|---|---|---|---|---|---|
| 1980's | 56,241 | 41,400 | 42,972 | 44,765 | 38,595 | 38,062 | ||||
| 1990's | 46,743 | 35,518 | 31,861 | 22,217 | 34,833 | 21,200 | 15,562 | 12,184 | 14,034 | 9,501 |
| 2000's | 17,569 | 27,478 | 20,840 | 23,375 | 16,176 | 21,782 | 13,699 | 21,824 | 32,511 | 17,412 |
| 2010's | 20,464 | 18,954 | 13,814 | 13,327 | 13,126 | 15,838 | 16,445 | 9,653 | 12,314 | 8,495 |
| 2020's | 15,712 |
| - = No Data Reported; -- = Not Applicable; NA = Not Available; W = Withheld to avoid disclosure of individual company data. |
| Release Date: 2/9/2022 |
| Next Release Date: Suspended |