|
Download Data (XLS File) |
|
|||||
|
|||||
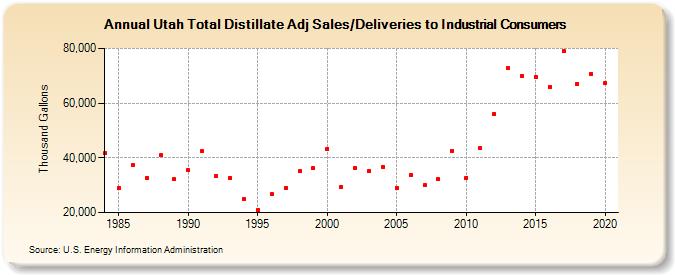
| Utah Total Distillate Adj Sales/Deliveries to Industrial Consumers (Thousand Gallons) | |||||
| Decade | Year-0 | Year-1 | Year-2 | Year-3 | Year-4 | Year-5 | Year-6 | Year-7 | Year-8 | Year-9 |
|---|---|---|---|---|---|---|---|---|---|---|
| 1980's | 41,712 | 28,924 | 37,248 | 32,639 | 40,870 | 32,114 | ||||
| 1990's | 35,382 | 42,378 | 33,360 | 32,779 | 24,797 | 20,946 | 26,713 | 29,082 | 35,067 | 36,114 |
| 2000's | 43,360 | 29,457 | 36,438 | 35,078 | 36,756 | 29,088 | 33,686 | 29,962 | 32,242 | 42,634 |
| 2010's | 32,745 | 43,517 | 56,202 | 72,673 | 69,984 | 69,658 | 65,984 | 79,036 | 67,074 | 70,723 |
| 2020's | 67,171 |
| - = No Data Reported; -- = Not Applicable; NA = Not Available; W = Withheld to avoid disclosure of individual company data. |
| Release Date: 2/9/2022 |
| Next Release Date: Suspended |