|
Download Data (XLS File) |
|
|||||
|
|||||
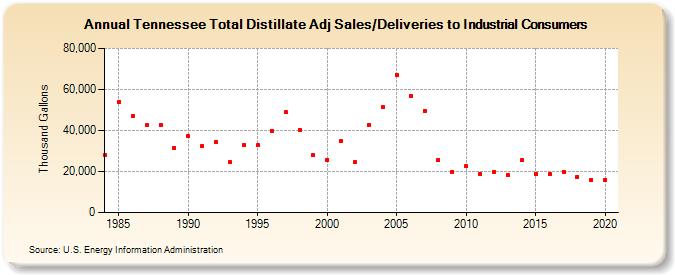
| Tennessee Total Distillate Adj Sales/Deliveries to Industrial Consumers (Thousand Gallons) | |||||
| Decade | Year-0 | Year-1 | Year-2 | Year-3 | Year-4 | Year-5 | Year-6 | Year-7 | Year-8 | Year-9 |
|---|---|---|---|---|---|---|---|---|---|---|
| 1980's | 27,980 | 54,118 | 46,832 | 42,537 | 42,657 | 31,685 | ||||
| 1990's | 37,181 | 32,506 | 34,204 | 24,417 | 32,967 | 32,698 | 39,956 | 48,822 | 40,371 | 27,837 |
| 2000's | 25,804 | 34,784 | 24,492 | 42,796 | 51,218 | 67,250 | 56,939 | 49,601 | 25,809 | 19,828 |
| 2010's | 22,510 | 18,695 | 19,980 | 18,375 | 25,425 | 19,024 | 18,685 | 19,911 | 17,402 | 15,933 |
| 2020's | 16,001 |
| - = No Data Reported; -- = Not Applicable; NA = Not Available; W = Withheld to avoid disclosure of individual company data. |
| Release Date: 2/9/2022 |
| Next Release Date: Suspended |