|
Download Data (XLS File) |
|
|||||
|
|||||
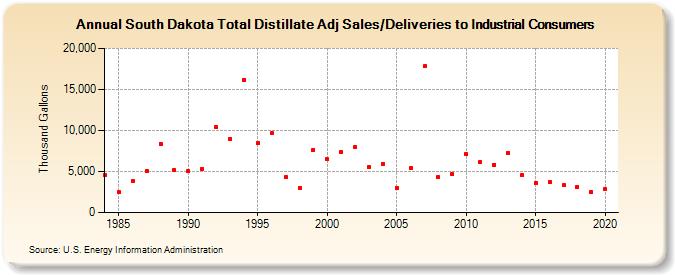
| South Dakota Total Distillate Adj Sales/Deliveries to Industrial Consumers (Thousand Gallons) | |||||
| Decade | Year-0 | Year-1 | Year-2 | Year-3 | Year-4 | Year-5 | Year-6 | Year-7 | Year-8 | Year-9 |
|---|---|---|---|---|---|---|---|---|---|---|
| 1980's | 4,546 | 2,474 | 3,794 | 5,119 | 8,409 | 5,144 | ||||
| 1990's | 5,044 | 5,348 | 10,405 | 9,021 | 16,189 | 8,461 | 9,654 | 4,315 | 3,036 | 7,678 |
| 2000's | 6,465 | 7,357 | 8,025 | 5,559 | 5,924 | 3,046 | 5,386 | 17,801 | 4,316 | 4,696 |
| 2010's | 7,126 | 6,177 | 5,838 | 7,294 | 4,553 | 3,558 | 3,704 | 3,297 | 3,150 | 2,488 |
| 2020's | 2,832 |
| - = No Data Reported; -- = Not Applicable; NA = Not Available; W = Withheld to avoid disclosure of individual company data. |
| Release Date: 2/9/2022 |
| Next Release Date: Suspended |