|
Download Data (XLS File) |
|
|||||
|
|||||
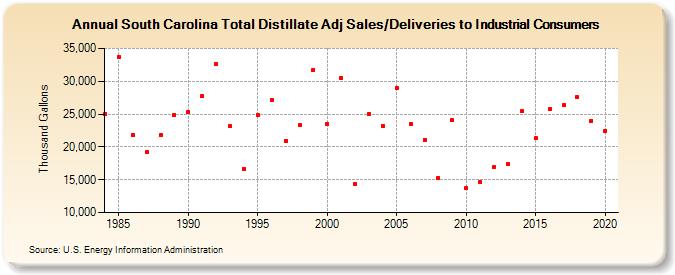
| South Carolina Total Distillate Adj Sales/Deliveries to Industrial Consumers (Thousand Gallons) | |||||
| Decade | Year-0 | Year-1 | Year-2 | Year-3 | Year-4 | Year-5 | Year-6 | Year-7 | Year-8 | Year-9 |
|---|---|---|---|---|---|---|---|---|---|---|
| 1980's | 25,044 | 33,649 | 21,825 | 19,171 | 21,804 | 24,867 | ||||
| 1990's | 25,341 | 27,713 | 32,602 | 23,176 | 16,672 | 24,906 | 27,157 | 20,971 | 23,294 | 31,774 |
| 2000's | 23,469 | 30,508 | 14,418 | 25,064 | 23,212 | 28,946 | 23,527 | 21,089 | 15,297 | 24,092 |
| 2010's | 13,753 | 14,639 | 16,882 | 17,384 | 25,417 | 21,335 | 25,734 | 26,375 | 27,555 | 23,985 |
| 2020's | 22,492 |
| - = No Data Reported; -- = Not Applicable; NA = Not Available; W = Withheld to avoid disclosure of individual company data. |
| Release Date: 2/9/2022 |
| Next Release Date: Suspended |