|
Download Data (XLS File) |
|
|||||
|
|||||
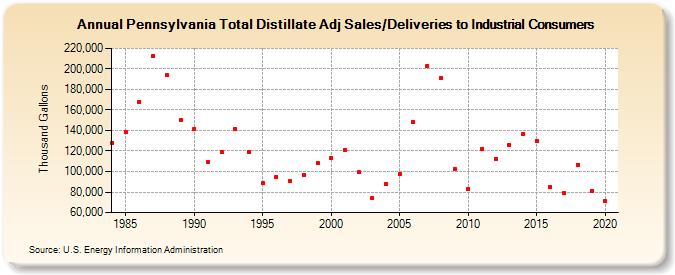
| Pennsylvania Total Distillate Adj Sales/Deliveries to Industrial Consumers (Thousand Gallons) | |||||
| Decade | Year-0 | Year-1 | Year-2 | Year-3 | Year-4 | Year-5 | Year-6 | Year-7 | Year-8 | Year-9 |
|---|---|---|---|---|---|---|---|---|---|---|
| 1980's | 128,229 | 138,695 | 168,109 | 212,659 | 193,592 | 150,398 | ||||
| 1990's | 141,696 | 109,552 | 119,180 | 141,764 | 119,068 | 88,504 | 95,102 | 90,280 | 97,008 | 108,045 |
| 2000's | 113,358 | 120,526 | 99,272 | 74,299 | 88,220 | 97,754 | 148,536 | 202,425 | 191,357 | 102,303 |
| 2010's | 83,065 | 122,433 | 112,555 | 126,080 | 136,358 | 130,034 | 85,301 | 79,299 | 106,784 | 80,626 |
| 2020's | 71,271 |
| - = No Data Reported; -- = Not Applicable; NA = Not Available; W = Withheld to avoid disclosure of individual company data. |
| Release Date: 2/9/2022 |
| Next Release Date: Suspended |