|
Download Data (XLS File) |
|
|||||
|
|||||
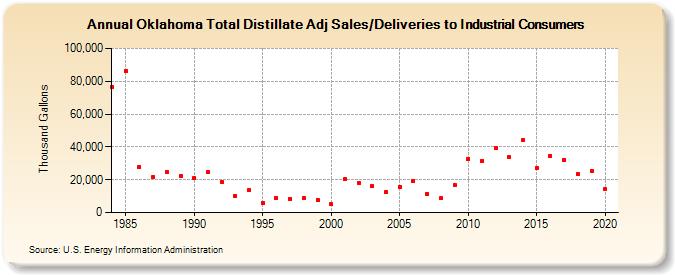
| Oklahoma Total Distillate Adj Sales/Deliveries to Industrial Consumers (Thousand Gallons) | |||||
| Decade | Year-0 | Year-1 | Year-2 | Year-3 | Year-4 | Year-5 | Year-6 | Year-7 | Year-8 | Year-9 |
|---|---|---|---|---|---|---|---|---|---|---|
| 1980's | 76,381 | 86,300 | 27,761 | 21,875 | 24,679 | 22,281 | ||||
| 1990's | 21,049 | 24,694 | 18,706 | 10,224 | 13,690 | 5,939 | 8,899 | 8,532 | 8,832 | 7,832 |
| 2000's | 4,993 | 20,188 | 18,159 | 15,903 | 12,585 | 15,578 | 19,188 | 11,460 | 8,628 | 16,875 |
| 2010's | 32,844 | 31,628 | 39,348 | 33,663 | 43,966 | 27,423 | 34,659 | 32,202 | 23,428 | 25,427 |
| 2020's | 14,193 |
| - = No Data Reported; -- = Not Applicable; NA = Not Available; W = Withheld to avoid disclosure of individual company data. |
| Release Date: 2/9/2022 |
| Next Release Date: Suspended |