|
Download Data (XLS File) |
|
|||||
|
|||||
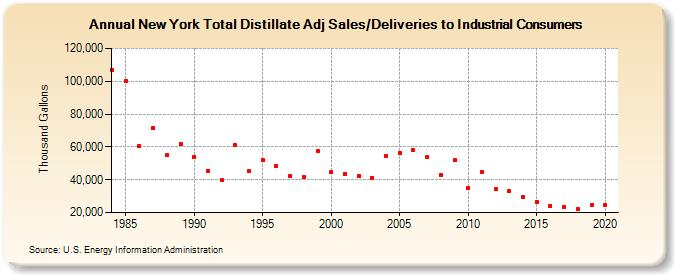
| New York Total Distillate Adj Sales/Deliveries to Industrial Consumers (Thousand Gallons) | |||||
| Decade | Year-0 | Year-1 | Year-2 | Year-3 | Year-4 | Year-5 | Year-6 | Year-7 | Year-8 | Year-9 |
|---|---|---|---|---|---|---|---|---|---|---|
| 1980's | 107,136 | 100,278 | 60,736 | 71,588 | 55,117 | 62,048 | ||||
| 1990's | 54,145 | 45,537 | 39,994 | 61,228 | 45,032 | 51,832 | 48,266 | 42,399 | 41,789 | 57,298 |
| 2000's | 44,788 | 43,764 | 42,299 | 41,128 | 54,453 | 56,169 | 57,859 | 53,626 | 42,934 | 51,921 |
| 2010's | 34,911 | 44,640 | 34,591 | 33,236 | 29,778 | 26,545 | 24,022 | 23,347 | 21,965 | 24,418 |
| 2020's | 24,429 |
| - = No Data Reported; -- = Not Applicable; NA = Not Available; W = Withheld to avoid disclosure of individual company data. |
| Release Date: 2/9/2022 |
| Next Release Date: Suspended |