|
Download Data (XLS File) |
|
|||||
|
|||||
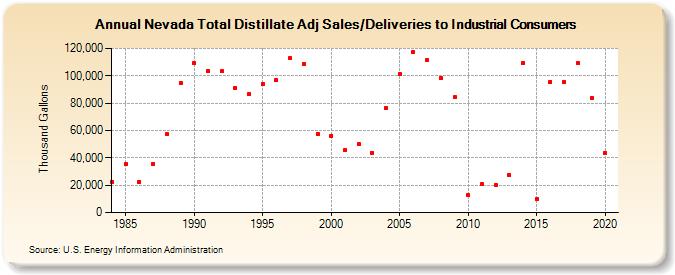
| Nevada Total Distillate Adj Sales/Deliveries to Industrial Consumers (Thousand Gallons) | |||||
| Decade | Year-0 | Year-1 | Year-2 | Year-3 | Year-4 | Year-5 | Year-6 | Year-7 | Year-8 | Year-9 |
|---|---|---|---|---|---|---|---|---|---|---|
| 1980's | 22,605 | 35,333 | 22,697 | 35,521 | 57,528 | 94,996 | ||||
| 1990's | 109,005 | 103,220 | 103,187 | 91,183 | 86,496 | 93,907 | 96,650 | 112,627 | 108,879 | 57,596 |
| 2000's | 56,175 | 45,552 | 49,980 | 43,846 | 76,410 | 101,385 | 117,275 | 111,223 | 98,267 | 84,147 |
| 2010's | 12,620 | 20,625 | 20,196 | 27,655 | 109,550 | 10,022 | 95,650 | 95,267 | 109,174 | 83,702 |
| 2020's | 43,771 |
| - = No Data Reported; -- = Not Applicable; NA = Not Available; W = Withheld to avoid disclosure of individual company data. |
| Release Date: 2/9/2022 |
| Next Release Date: Suspended |