|
Download Data (XLS File) |
|
|||||
|
|||||
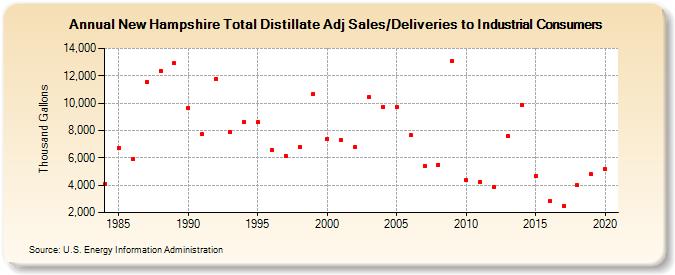
| New Hampshire Total Distillate Adj Sales/Deliveries to Industrial Consumers (Thousand Gallons) | |||||
| Decade | Year-0 | Year-1 | Year-2 | Year-3 | Year-4 | Year-5 | Year-6 | Year-7 | Year-8 | Year-9 |
|---|---|---|---|---|---|---|---|---|---|---|
| 1980's | 4,071 | 6,729 | 5,912 | 11,542 | 12,381 | 12,902 | ||||
| 1990's | 9,644 | 7,717 | 11,792 | 7,907 | 8,621 | 8,583 | 6,589 | 6,118 | 6,822 | 10,648 |
| 2000's | 7,403 | 7,311 | 6,817 | 10,430 | 9,748 | 9,688 | 7,650 | 5,433 | 5,509 | 13,087 |
| 2010's | 4,358 | 4,254 | 3,876 | 7,614 | 9,889 | 4,650 | 2,841 | 2,486 | 3,982 | 4,794 |
| 2020's | 5,165 |
| - = No Data Reported; -- = Not Applicable; NA = Not Available; W = Withheld to avoid disclosure of individual company data. |
| Release Date: 2/9/2022 |
| Next Release Date: Suspended |