|
Download Data (XLS File) |
|
|||||
|
|||||
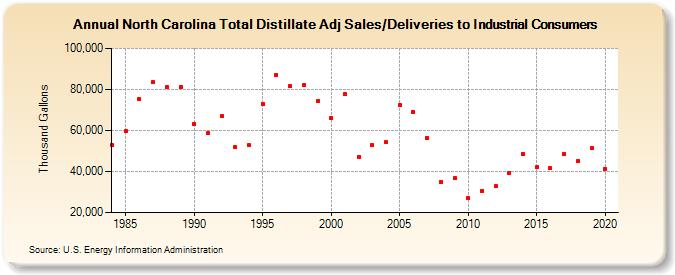
| North Carolina Total Distillate Adj Sales/Deliveries to Industrial Consumers (Thousand Gallons) | |||||
| Decade | Year-0 | Year-1 | Year-2 | Year-3 | Year-4 | Year-5 | Year-6 | Year-7 | Year-8 | Year-9 |
|---|---|---|---|---|---|---|---|---|---|---|
| 1980's | 52,934 | 59,582 | 75,319 | 83,480 | 81,008 | 81,108 | ||||
| 1990's | 63,289 | 58,559 | 66,845 | 51,707 | 52,778 | 73,053 | 87,182 | 81,572 | 82,075 | 74,136 |
| 2000's | 66,037 | 77,699 | 46,901 | 52,921 | 54,148 | 72,320 | 69,133 | 56,439 | 34,938 | 36,669 |
| 2010's | 27,273 | 30,566 | 32,832 | 39,429 | 48,568 | 42,059 | 41,517 | 48,730 | 45,037 | 51,251 |
| 2020's | 41,425 |
| - = No Data Reported; -- = Not Applicable; NA = Not Available; W = Withheld to avoid disclosure of individual company data. |
| Release Date: 2/9/2022 |
| Next Release Date: Suspended |