|
Download Data (XLS File) |
|
|||||
|
|||||
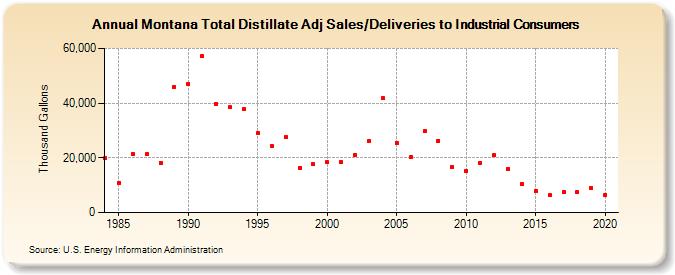
| Montana Total Distillate Adj Sales/Deliveries to Industrial Consumers (Thousand Gallons) | |||||
| Decade | Year-0 | Year-1 | Year-2 | Year-3 | Year-4 | Year-5 | Year-6 | Year-7 | Year-8 | Year-9 |
|---|---|---|---|---|---|---|---|---|---|---|
| 1980's | 19,793 | 10,914 | 21,347 | 21,278 | 18,124 | 45,880 | ||||
| 1990's | 47,058 | 57,083 | 39,855 | 38,462 | 37,839 | 29,128 | 24,327 | 27,654 | 16,432 | 17,588 |
| 2000's | 18,332 | 18,355 | 21,135 | 26,059 | 41,798 | 25,578 | 20,284 | 29,655 | 26,252 | 16,701 |
| 2010's | 15,357 | 18,192 | 20,921 | 16,037 | 10,586 | 7,829 | 6,266 | 7,549 | 7,395 | 8,925 |
| 2020's | 6,452 |
| - = No Data Reported; -- = Not Applicable; NA = Not Available; W = Withheld to avoid disclosure of individual company data. |
| Release Date: 2/9/2022 |
| Next Release Date: Suspended |