|
Download Data (XLS File) |
|
|||||
|
|||||
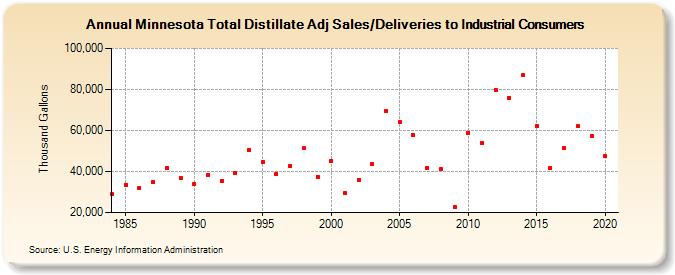
| Minnesota Total Distillate Adj Sales/Deliveries to Industrial Consumers (Thousand Gallons) | |||||
| Decade | Year-0 | Year-1 | Year-2 | Year-3 | Year-4 | Year-5 | Year-6 | Year-7 | Year-8 | Year-9 |
|---|---|---|---|---|---|---|---|---|---|---|
| 1980's | 28,891 | 33,651 | 32,092 | 34,665 | 41,621 | 36,800 | ||||
| 1990's | 34,084 | 38,423 | 35,606 | 39,519 | 50,438 | 44,842 | 38,907 | 42,829 | 51,221 | 37,532 |
| 2000's | 45,190 | 29,438 | 35,990 | 43,581 | 69,639 | 64,278 | 57,692 | 41,636 | 41,093 | 22,677 |
| 2010's | 58,920 | 53,928 | 79,727 | 75,961 | 86,813 | 62,134 | 41,740 | 51,473 | 62,058 | 57,370 |
| 2020's | 47,341 |
| - = No Data Reported; -- = Not Applicable; NA = Not Available; W = Withheld to avoid disclosure of individual company data. |
| Release Date: 2/9/2022 |
| Next Release Date: Suspended |