|
Download Data (XLS File) |
|
|||||
|
|||||
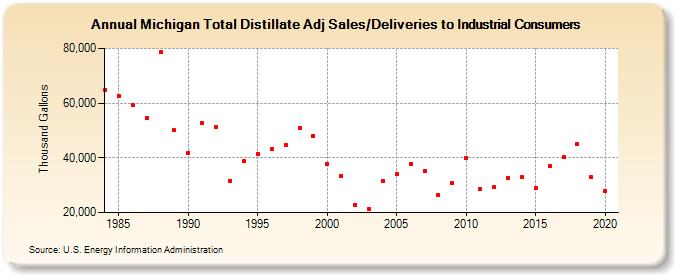
| Michigan Total Distillate Adj Sales/Deliveries to Industrial Consumers (Thousand Gallons) | |||||
| Decade | Year-0 | Year-1 | Year-2 | Year-3 | Year-4 | Year-5 | Year-6 | Year-7 | Year-8 | Year-9 |
|---|---|---|---|---|---|---|---|---|---|---|
| 1980's | 64,878 | 62,748 | 59,349 | 54,714 | 78,573 | 50,080 | ||||
| 1990's | 41,792 | 52,858 | 51,140 | 31,561 | 38,742 | 41,584 | 43,278 | 44,609 | 51,046 | 48,029 |
| 2000's | 37,611 | 33,326 | 22,938 | 21,478 | 31,644 | 34,074 | 37,916 | 35,266 | 26,323 | 30,752 |
| 2010's | 40,053 | 28,678 | 29,278 | 32,737 | 33,081 | 29,093 | 36,980 | 40,185 | 44,947 | 32,936 |
| 2020's | 27,985 |
| - = No Data Reported; -- = Not Applicable; NA = Not Available; W = Withheld to avoid disclosure of individual company data. |
| Release Date: 2/9/2022 |
| Next Release Date: Suspended |