|
Download Data (XLS File) |
|
|||||
|
|||||
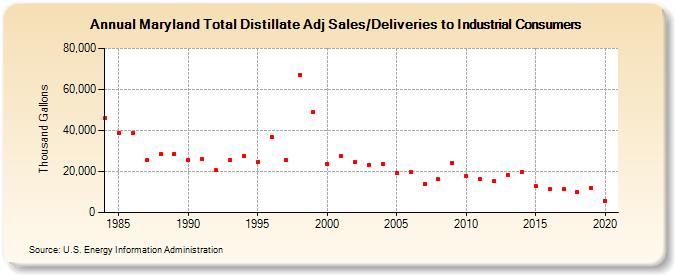
| Maryland Total Distillate Adj Sales/Deliveries to Industrial Consumers (Thousand Gallons) | |||||
| Decade | Year-0 | Year-1 | Year-2 | Year-3 | Year-4 | Year-5 | Year-6 | Year-7 | Year-8 | Year-9 |
|---|---|---|---|---|---|---|---|---|---|---|
| 1980's | 45,936 | 38,934 | 38,621 | 25,500 | 28,327 | 28,770 | ||||
| 1990's | 25,505 | 26,094 | 20,516 | 25,635 | 27,531 | 24,853 | 36,982 | 25,745 | 67,230 | 48,973 |
| 2000's | 23,425 | 27,585 | 24,527 | 23,243 | 23,680 | 19,439 | 19,895 | 14,016 | 16,207 | 24,346 |
| 2010's | 17,705 | 16,153 | 15,184 | 18,245 | 19,762 | 12,976 | 11,330 | 11,380 | 9,869 | 11,854 |
| 2020's | 5,780 |
| - = No Data Reported; -- = Not Applicable; NA = Not Available; W = Withheld to avoid disclosure of individual company data. |
| Release Date: 2/9/2022 |
| Next Release Date: Suspended |