|
Download Data (XLS File) |
|
|||||
|
|||||
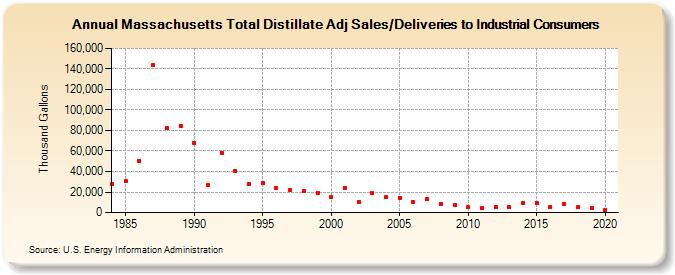
| Massachusetts Total Distillate Adj Sales/Deliveries to Industrial Consumers (Thousand Gallons) | |||||
| Decade | Year-0 | Year-1 | Year-2 | Year-3 | Year-4 | Year-5 | Year-6 | Year-7 | Year-8 | Year-9 |
|---|---|---|---|---|---|---|---|---|---|---|
| 1980's | 27,522 | 30,429 | 50,658 | 144,029 | 81,932 | 84,689 | ||||
| 1990's | 67,671 | 27,164 | 58,421 | 40,319 | 28,120 | 28,613 | 24,058 | 21,784 | 20,701 | 19,469 |
| 2000's | 15,080 | 24,325 | 10,315 | 19,105 | 14,686 | 14,656 | 10,084 | 13,170 | 8,557 | 7,072 |
| 2010's | 4,960 | 4,872 | 5,582 | 5,824 | 9,258 | 9,502 | 5,684 | 8,263 | 5,125 | 4,284 |
| 2020's | 2,792 |
| - = No Data Reported; -- = Not Applicable; NA = Not Available; W = Withheld to avoid disclosure of individual company data. |
| Release Date: 2/9/2022 |
| Next Release Date: Suspended |