|
Download Data (XLS File) |
|
|||||
|
|||||
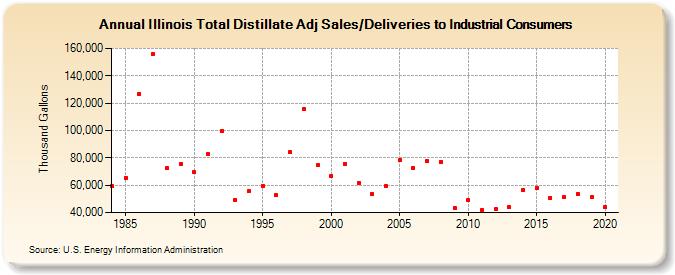
| Illinois Total Distillate Adj Sales/Deliveries to Industrial Consumers (Thousand Gallons) | |||||
| Decade | Year-0 | Year-1 | Year-2 | Year-3 | Year-4 | Year-5 | Year-6 | Year-7 | Year-8 | Year-9 |
|---|---|---|---|---|---|---|---|---|---|---|
| 1980's | 59,158 | 65,621 | 126,665 | 156,101 | 72,447 | 75,664 | ||||
| 1990's | 69,430 | 82,841 | 99,499 | 49,266 | 55,409 | 59,580 | 52,819 | 84,135 | 115,874 | 74,446 |
| 2000's | 66,769 | 75,494 | 61,925 | 53,887 | 59,574 | 78,778 | 72,749 | 77,485 | 77,213 | 43,500 |
| 2010's | 48,817 | 42,105 | 42,287 | 43,770 | 56,394 | 58,135 | 50,942 | 51,085 | 53,817 | 51,056 |
| 2020's | 43,975 |
| - = No Data Reported; -- = Not Applicable; NA = Not Available; W = Withheld to avoid disclosure of individual company data. |
| Release Date: 2/9/2022 |
| Next Release Date: Suspended |