|
Download Data (XLS File) |
|
|||||
|
|||||
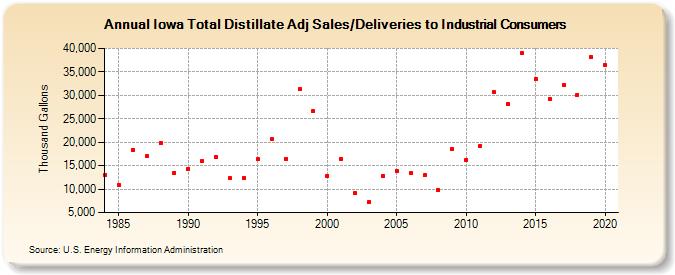
| Iowa Total Distillate Adj Sales/Deliveries to Industrial Consumers (Thousand Gallons) | |||||
| Decade | Year-0 | Year-1 | Year-2 | Year-3 | Year-4 | Year-5 | Year-6 | Year-7 | Year-8 | Year-9 |
|---|---|---|---|---|---|---|---|---|---|---|
| 1980's | 13,091 | 10,890 | 18,432 | 16,987 | 19,781 | 13,458 | ||||
| 1990's | 14,317 | 15,944 | 16,865 | 12,288 | 12,332 | 16,315 | 20,597 | 16,503 | 31,388 | 26,590 |
| 2000's | 12,881 | 16,462 | 9,130 | 7,201 | 12,872 | 13,822 | 13,378 | 12,949 | 9,854 | 18,580 |
| 2010's | 16,265 | 19,241 | 30,642 | 28,148 | 39,038 | 33,497 | 29,302 | 32,203 | 30,130 | 38,126 |
| 2020's | 36,440 |
| - = No Data Reported; -- = Not Applicable; NA = Not Available; W = Withheld to avoid disclosure of individual company data. |
| Release Date: 2/9/2022 |
| Next Release Date: Suspended |