|
Download Data (XLS File) |
|
|||||
|
|||||
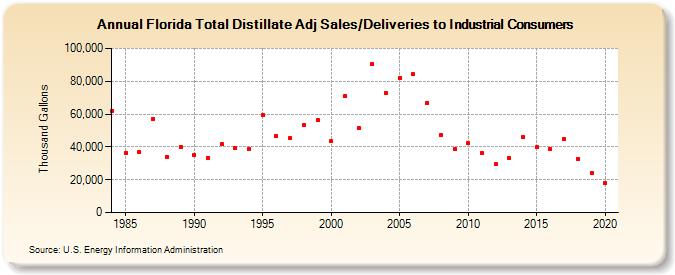
| Florida Total Distillate Adj Sales/Deliveries to Industrial Consumers (Thousand Gallons) | |||||
| Decade | Year-0 | Year-1 | Year-2 | Year-3 | Year-4 | Year-5 | Year-6 | Year-7 | Year-8 | Year-9 |
|---|---|---|---|---|---|---|---|---|---|---|
| 1980's | 62,068 | 36,490 | 37,009 | 57,029 | 34,013 | 39,961 | ||||
| 1990's | 35,044 | 33,288 | 41,461 | 39,396 | 39,014 | 59,559 | 46,436 | 45,437 | 53,374 | 56,360 |
| 2000's | 43,539 | 70,710 | 51,279 | 90,464 | 72,766 | 82,147 | 84,162 | 66,968 | 47,232 | 38,559 |
| 2010's | 42,149 | 36,283 | 29,336 | 33,033 | 45,832 | 39,702 | 38,537 | 44,890 | 32,802 | 24,239 |
| 2020's | 17,774 |
| - = No Data Reported; -- = Not Applicable; NA = Not Available; W = Withheld to avoid disclosure of individual company data. |
| Release Date: 2/9/2022 |
| Next Release Date: Suspended |