|
Download Data (XLS File) |
|
|||||
|
|||||
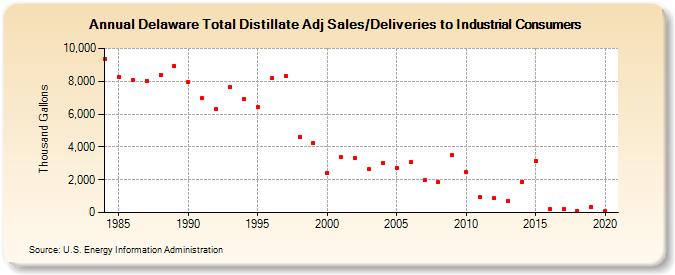
| Delaware Total Distillate Adj Sales/Deliveries to Industrial Consumers (Thousand Gallons) | |||||
| Decade | Year-0 | Year-1 | Year-2 | Year-3 | Year-4 | Year-5 | Year-6 | Year-7 | Year-8 | Year-9 |
|---|---|---|---|---|---|---|---|---|---|---|
| 1980's | 9,381 | 8,252 | 8,054 | 8,024 | 8,396 | 8,934 | ||||
| 1990's | 7,976 | 6,966 | 6,281 | 7,658 | 6,944 | 6,442 | 8,190 | 8,300 | 4,628 | 4,213 |
| 2000's | 2,433 | 3,366 | 3,305 | 2,638 | 3,018 | 2,708 | 3,058 | 1,956 | 1,849 | 3,502 |
| 2010's | 2,455 | 934 | 862 | 689 | 1,870 | 3,137 | 199 | 213 | 85 | 344 |
| 2020's | 65 |
| - = No Data Reported; -- = Not Applicable; NA = Not Available; W = Withheld to avoid disclosure of individual company data. |
| Release Date: 2/9/2022 |
| Next Release Date: Suspended |