|
Download Data (XLS File) |
|
|||||
|
|||||
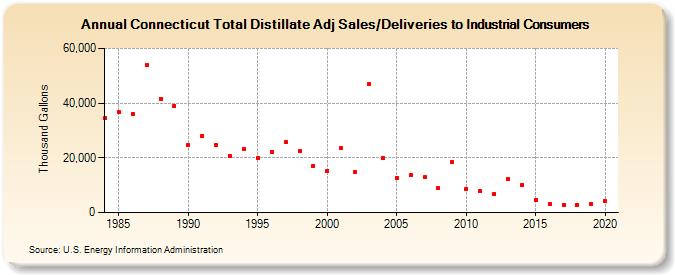
| Connecticut Total Distillate Adj Sales/Deliveries to Industrial Consumers (Thousand Gallons) | |||||
| Decade | Year-0 | Year-1 | Year-2 | Year-3 | Year-4 | Year-5 | Year-6 | Year-7 | Year-8 | Year-9 |
|---|---|---|---|---|---|---|---|---|---|---|
| 1980's | 34,489 | 36,715 | 36,171 | 53,835 | 41,539 | 39,079 | ||||
| 1990's | 24,633 | 28,132 | 24,530 | 20,773 | 23,283 | 19,974 | 22,245 | 25,772 | 22,405 | 17,143 |
| 2000's | 15,325 | 23,495 | 14,964 | 46,910 | 19,975 | 12,813 | 13,565 | 12,874 | 8,808 | 18,390 |
| 2010's | 8,780 | 7,710 | 6,791 | 12,443 | 10,039 | 4,429 | 3,066 | 2,857 | 2,942 | 3,239 |
| 2020's | 4,091 |
| - = No Data Reported; -- = Not Applicable; NA = Not Available; W = Withheld to avoid disclosure of individual company data. |
| Release Date: 2/9/2022 |
| Next Release Date: Suspended |