|
Download Data (XLS File) |
|
|||||
|
|||||
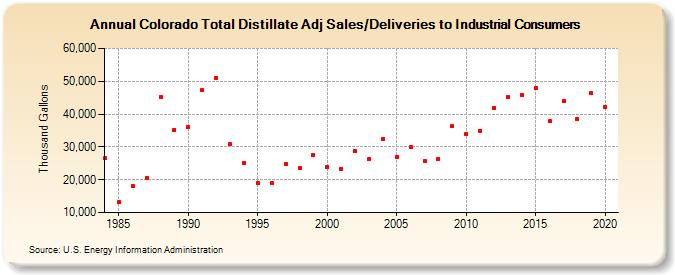
| Colorado Total Distillate Adj Sales/Deliveries to Industrial Consumers (Thousand Gallons) | |||||
| Decade | Year-0 | Year-1 | Year-2 | Year-3 | Year-4 | Year-5 | Year-6 | Year-7 | Year-8 | Year-9 |
|---|---|---|---|---|---|---|---|---|---|---|
| 1980's | 26,527 | 13,115 | 17,980 | 20,577 | 45,199 | 35,260 | ||||
| 1990's | 36,093 | 47,397 | 51,091 | 30,752 | 25,143 | 19,123 | 19,100 | 24,853 | 23,495 | 27,653 |
| 2000's | 23,919 | 23,310 | 28,820 | 26,184 | 32,346 | 27,073 | 29,845 | 25,722 | 26,441 | 36,280 |
| 2010's | 33,854 | 34,984 | 41,864 | 45,262 | 45,889 | 47,899 | 37,747 | 43,954 | 38,435 | 46,323 |
| 2020's | 42,054 |
| - = No Data Reported; -- = Not Applicable; NA = Not Available; W = Withheld to avoid disclosure of individual company data. |
| Release Date: 2/9/2022 |
| Next Release Date: Suspended |