|
Download Data (XLS File) |
|
|||||
|
|||||
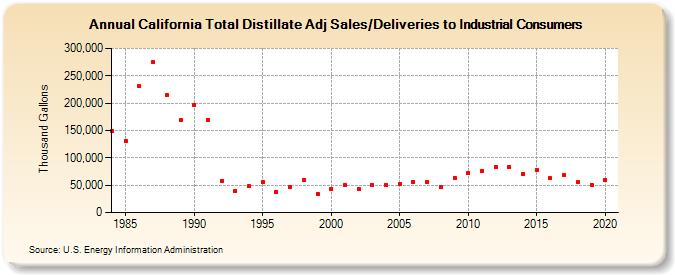
| California Total Distillate Adj Sales/Deliveries to Industrial Consumers (Thousand Gallons) | |||||
| Decade | Year-0 | Year-1 | Year-2 | Year-3 | Year-4 | Year-5 | Year-6 | Year-7 | Year-8 | Year-9 |
|---|---|---|---|---|---|---|---|---|---|---|
| 1980's | 149,166 | 131,205 | 230,602 | 274,630 | 215,198 | 168,271 | ||||
| 1990's | 196,947 | 169,924 | 58,191 | 39,502 | 48,160 | 55,527 | 37,738 | 46,881 | 60,089 | 34,810 |
| 2000's | 43,548 | 50,022 | 43,259 | 50,995 | 50,925 | 52,557 | 55,606 | 55,301 | 46,719 | 63,249 |
| 2010's | 72,475 | 76,693 | 83,690 | 83,304 | 70,278 | 78,018 | 62,402 | 67,936 | 56,079 | 50,890 |
| 2020's | 60,198 |
| - = No Data Reported; -- = Not Applicable; NA = Not Available; W = Withheld to avoid disclosure of individual company data. |
| Release Date: 2/9/2022 |
| Next Release Date: Suspended |