|
Download Data (XLS File) |
|
|||||
|
|||||
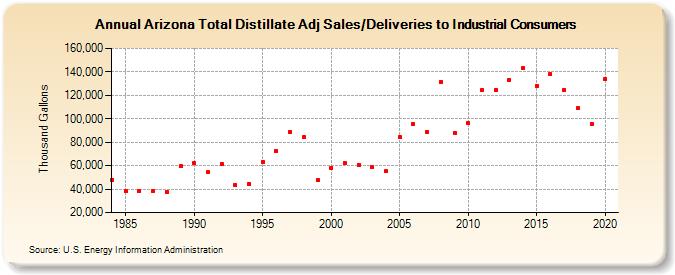
| Arizona Total Distillate Adj Sales/Deliveries to Industrial Consumers (Thousand Gallons) | |||||
| Decade | Year-0 | Year-1 | Year-2 | Year-3 | Year-4 | Year-5 | Year-6 | Year-7 | Year-8 | Year-9 |
|---|---|---|---|---|---|---|---|---|---|---|
| 1980's | 47,980 | 38,067 | 38,770 | 38,623 | 37,327 | 59,550 | ||||
| 1990's | 61,875 | 54,170 | 61,644 | 43,525 | 44,719 | 63,157 | 72,582 | 89,119 | 84,303 | 47,598 |
| 2000's | 58,334 | 62,340 | 60,750 | 58,587 | 55,162 | 84,086 | 95,579 | 88,935 | 131,488 | 87,829 |
| 2010's | 95,989 | 124,514 | 124,588 | 133,466 | 143,639 | 128,136 | 138,287 | 124,305 | 108,822 | 95,559 |
| 2020's | 134,041 |
| - = No Data Reported; -- = Not Applicable; NA = Not Available; W = Withheld to avoid disclosure of individual company data. |
| Release Date: 2/9/2022 |
| Next Release Date: Suspended |