|
Download Data (XLS File) |
|
|||||
|
|||||
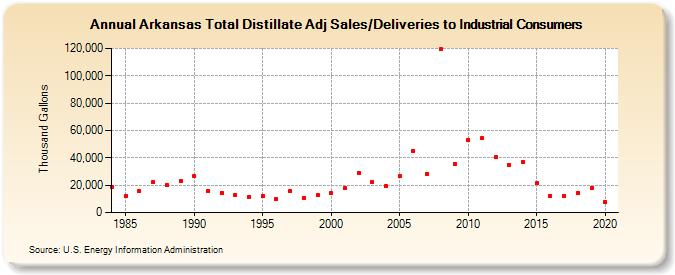
| Arkansas Total Distillate Adj Sales/Deliveries to Industrial Consumers (Thousand Gallons) | |||||
| Decade | Year-0 | Year-1 | Year-2 | Year-3 | Year-4 | Year-5 | Year-6 | Year-7 | Year-8 | Year-9 |
|---|---|---|---|---|---|---|---|---|---|---|
| 1980's | 18,358 | 11,983 | 15,462 | 22,016 | 20,300 | 22,918 | ||||
| 1990's | 26,400 | 16,007 | 14,617 | 13,043 | 11,612 | 11,870 | 9,593 | 15,955 | 10,856 | 12,782 |
| 2000's | 14,590 | 17,776 | 29,020 | 22,034 | 19,546 | 26,466 | 45,242 | 28,438 | 119,360 | 35,689 |
| 2010's | 53,162 | 54,261 | 40,606 | 35,109 | 36,926 | 21,316 | 12,299 | 11,976 | 14,367 | 18,146 |
| 2020's | 7,738 |
| - = No Data Reported; -- = Not Applicable; NA = Not Available; W = Withheld to avoid disclosure of individual company data. |
| Release Date: 2/9/2022 |
| Next Release Date: Suspended |