|
Download Data (XLS File) |
|
|||||
|
|||||
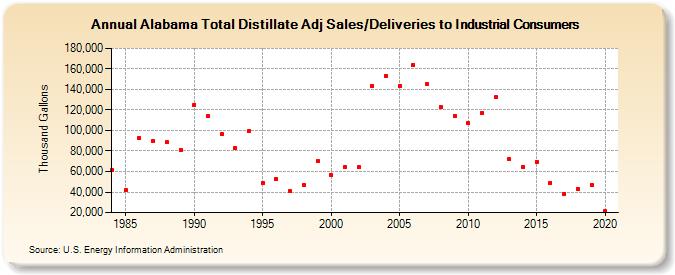
| Alabama Total Distillate Adj Sales/Deliveries to Industrial Consumers (Thousand Gallons) | |||||
| Decade | Year-0 | Year-1 | Year-2 | Year-3 | Year-4 | Year-5 | Year-6 | Year-7 | Year-8 | Year-9 |
|---|---|---|---|---|---|---|---|---|---|---|
| 1980's | 61,424 | 41,731 | 93,129 | 89,473 | 88,349 | 81,243 | ||||
| 1990's | 125,273 | 114,081 | 96,222 | 82,716 | 99,533 | 48,915 | 52,872 | 40,526 | 47,150 | 70,442 |
| 2000's | 56,173 | 64,342 | 64,309 | 143,211 | 153,421 | 143,747 | 163,922 | 145,045 | 123,047 | 114,122 |
| 2010's | 106,857 | 117,377 | 132,178 | 71,836 | 64,470 | 69,742 | 49,278 | 38,470 | 43,066 | 47,311 |
| 2020's | 21,041 |
| - = No Data Reported; -- = Not Applicable; NA = Not Available; W = Withheld to avoid disclosure of individual company data. |
| Release Date: 2/9/2022 |
| Next Release Date: Suspended |